So, this will be the last post on Black and Gold Box Score. I have been asked to start a new blog with three other Hawkeye bloggers, of which I am sure you have read along with my work. The new blog is much more aesthetically pleasing, and will have more content than I can produce by myself here.
Finally, I just want to thank everybody who stopped by here in the 8 months that this blog was running. I never intended to do a blog. It was a gradual step by step process. I was interested in stats because I love reading baseball analysis and I wanted to apply the same thing to my favorite college team. Then I started gathering data and spitting out results, and decided to share them. I still wasn't ready to start a blog, though, because I wasn't sure if I wanted a commitment like that. As a result, I created a Twitter account, and began spamming people's Twitter feeds with Iowa football and basketball stats. I did that for about four months, before I was able to land an entry level job in my field of study. Because it was an entry level job that didn't pay shit, I also had to keep my part time job. This made it impossible to sit and tweet Hawkeye stats all the time. That's how this blog started. I would put stats on here, and people could look at them as they pleased. It eventually evolved into a real blog. Next came previews and recaps, and then the longer offseason analysis posts. I went from having a handful of people read my first posts on here, to having many more reading my final posts here. I'm not sure what I planned on accomplishing when I started this blog, but I'm very happy with how it's turned out.
Now, though, it's on to the next chapter. The new blog is called The High Porch Picnic. As the name implies, I think it's going to be a great ol' time. Thanks for stopping by, and I hope to see you over there soon.
Tuesday, August 16, 2011
Monday, July 18, 2011
A Snapshot of the Big Ten from 2005-2010

As it turns out, I've been really busy lately. You know with life and all that kind of stuff. I've actually had this piece sitting around for a couple of days, but have been too busy to proofread and publish it. I'm probably going to continue being busy for a while, so the posting will be even more sporadic here than it already is during the offseason. As a result, this isn't one of my usual long-winded posts. Instead, you get a chart and a list. Fun for everyone!
Anyway, I decided to look at every B1G team's S&P+ over the last six years. Why? Well, because S&P+ data only goes back that far. I got the numbers from the Football Outsiders database, which you can find here (For those of you that aren't familiar with S&P+, read their definitions at the top of the link). Remember, these are where a team ranks nationally (out of 120), according to S&P+. So, the lower the number, the better.
I added Nebraska in here, even though they haven't played in the B1G yet. S&P+ adjusts for strength of schedule, so every team is comparable. They are the black line on the chart, because Wisconsin and them are kind of hard to tell apart color scheme wise. You can think of it as black for the Blackshirts (You're welcome, Husker fans. I won't be this nice come football season).
For the chart, I used a rolling average for each team that took into account each of the years previous. I did this for a couple of reasons: 1) To try to pick up on trends that give us a visual snapshot of each football program over the last six years. 2) To smooth out the team lines, and make the chart look a lot less jumbled.
Below, you will find each team's six year average in order from best to worst, along with some quick commentary.
Saturday, July 9, 2011
A Quick Post on 2010's Fourth Quarter Collapses
 |
| I think we all remember what happened just before this... (Nam Y. Huh | AP) |
For those of you not familiar with the stats used at Football Study Hall, they come from Football Outsiders. Basically, it's like Sabermetrics (if you're a baseball fan), but for football. S&P+ is basically a combination ranking of two of their stats. The first stat is Success Rate, which basically measures how good a team is at moving the ball on offense or stopping the opposing team from moving the ball on defense. The second stat is Equivalent Points Per Play, which measures how explosive an offense is or how good a defense is at not allowing big plays. These two stats get added together like on-base percentage and slugging percentage do in baseball (OPS) to create S&P+. (To get full definitions of these stats check out this link)
Anyway, why did I look at Iowa's S&P+ by quarter for 2010? Because I wanted to see what the hell happened during Iowa's famous fourth quarter collapses last year. Let's find out.
To the graphs!
Wednesday, July 6, 2011
A Trip Down Memory Lane: Remembering the Dominance of Evy, the Coach
Lately, I've found myself over at Sports Reference's college football site quite a bit, looking at Iowa's past results throughout history. After going back through the Ferentz and Fry years, I found myself gravitating to the late 1950's (you know, since the 60's and 70's were such a clusterfuck) and the fantastic Iowa teams led by none other than Forest Evashevski.
Evy, as most people called him, had an interesting career at Iowa. He coached a total of nine years for the Hawkeyes. The last five of which, are some of the greatest football Iowa has ever played. In the late 1950's, Evy (known for his stubborn ways) and Iowa's Athletic Director Paul Brechler had a public feud. Brechler left that year to be the commissioner of the Skyline Conference, and Evy tried to lead the Hawkeyes to more glory from above in 1961. As most Hawkeye fans know, however, Evy was a better coach than he was an AD. After he left the coaching seat, Iowa went into a tailspin that would take decades to correct.
So, to review very briefly: 1) Evy was not the most pleasant man in the world. 2) He was a terrible Athletic Director. But, this post isn't about either of those. Instead, this post is about his nine year career as the head coach of the Iowa Hawkeyes, and just how damn good he was at his job.
Let's start off by looking at the stat that coaches are most judged by. Wins.

It's pretty clear that it took Evashevski a couple years to build the program up. The first four years saw mediocre results, at best. Over the final five years, though, he made Iowa a powerhouse. Since the schedule was shorter back then, compared to how many games teams play now a days. Let's look at win percentage.
Saturday, July 2, 2011
A Trip Down Memory Lane: The Most Disappointing Season Ever? 1997
 |
| One of the few pictures I could find of the 1997 season. And it doesn't go with this post at all! |
Then Black Heart Gold Pants came out with a post, talking about using points scored and points allowed to calculate a team's expected winning percentage. Football's Pythagorean Theorem, if you will. Naturally, being the Hawkeye nerd that I am, I decided to calculate Iowa's Pythagorean win percentage for every year all the way through 1979. Season by season, I entered points scored and points allowed into an Excel spread sheet and came up with an expected win percentage.
Naturally, the 2010 team really underperformed. They were expected to win about 2 more games than they actually did. However, their difference of 2.13 more expected wins than actual wins, was not the worst. Not even in the Ferentz era. The 2008 season 2.46 was slightly worse (as BHGP pointed out here). When you add Fry's twenty year career into the equation, 2010 was the fifth most underachieving team as predicted by the Pythagorean Theorem. So what season was number one, you might ask? And by a very large margin? Why, 1997 of course.
Let's look at the Top Five Most Underachieving Iowa Teams since 1979 through the eyes of football's Pythagorean Theorem:
Friday, June 24, 2011
James Vandenberg in 2011: What can we Expect?
 |
| More of this. Less Nortwestern/Minnesota please. (Photo by Jamie Sabau/Getty Images North America) |
As Iowa fans, we had grown accustomed to seeing Ricky Stanzi line up under center for the last three years. But, his replacement, James Vandenberg, isn't a totally new face. Hawkeye fans know who he is. He has seen action in 7 games over his career, and started two of them. He already has a reputation built up around him, as he came ever so close to beating Ohio State at the Horseshoe back in 2009. He had a bit of an interception problem that game, but he completed 60.6% of his passes and averaged 7.1 yards per attempt. Pretty good against a team that allowed a completion percentage of 54.3% and an average of 5.4 yards per attempt on the season. Not to mention, that Vandenberg threw 20% of all touchdown passes allowed by the Ohio State secondary that year.
However, it wasn't all great in 2009. Vandenberg struggled against Northwestern and Minnesota. He didn't really take any meangingful snaps last season, so Iowa fans only have memories of that 2009 season to go off of.
After having another year and a half since his last meaningful pass attempt in a game, Vandenberg should be much more comfortable stepping in as the starting quarterback for the most popular team in a state of about 3 million people. So what are some realistic expectations for him this upcoming season?
Tuesday, June 14, 2011
Marvin McNutt and Iowa's Receiving Records
 |
| 7 got 6. (Photo courtesy of AP) |
Flash forward to 2009. Marvin McNutt impresses in the offseason, and moves all the way up the depth chart to starting wide receiver. Hawkeye fans had heard good things about him in the offseason, but had no idea what to expect come opening kickoff that year. Then, McNutt burst onto the Big 10 scene. He led the Hawkeyes in receiving touchdowns and finished second in catches and yards in his first full year at the position. He was a natural.
His amazing story has sparked this question for me? Could he graduate as the best wide receiver in Iowa Hawkeye history?
It's crazy that we can even have this conversation so soon, considering Derrell Johnson-Koulianos, who broke many of Iowa's receiving records, just finished his career last year. Many Iowa fans (those that haven't completely disowned him yet, for his personality and off the field incidents) consider DJK to be the greatest Iowa wide receiver of all time. So, leaving DJK's controversial personality out of the picture, how does McNutt compare numbers wise? Could he become the best wide receiver in Iowa history?
Sunday, June 12, 2011
A Trip Down Memory Lane: 2006 Iowa at Syracuse, "The Stand"
 |
| Yeah. That seems about right. (Photo, obviously, courtesy of LIFE Magazine) |
To reiterate my point about this game being ugly. Take a look at the drive chart:

Iowa's fourth drive ended in a touchdown, and their eighth drive ended in a field goal. That was it for regulation. Of their 9 drives in regulation that didn't end with a score, Iowa ended 4 of them with an interception, 4 with a punt, and 1 with a missed field goal. Yikes.
Syracuse scored a touchdown on their first drive, and didn't turn the ball over as much as the Jason Manson quarterbacked Hawkeyes did. However, they also didn't move the ball very much. In their 10 drives that did not end in a score, Syracuse only had 1 drive where they averaged above 4 yards per play. That one drive, the tenth drive, they averaged 6.71 yards per play, but then missed a field goal. They also had three drives where they went backwards, averaging negative yards per play. In other words, Iowa's defense was doing it's best to win the game, despite an offense that was doing it's best to give away the game.
In the end, the defense did win this game for Iowa. I mean, the offense got the winning touchdown in overtime. But, the defense put together an amazing 8 play goal line stand. The Iowa defense did give Syracuse every opportunity to tie the game, as they decided to get called for pass interference at the goal line twice. Nonetheless, the penalties ended up making this goal line stand even more special, and these 8 plays, are what made Hawkeye fans want to go from drinking to forget this game, to drinking in celebration of this game. So, let's reflect on those final 8 plays. Shall we?
Sunday, June 5, 2011
A Trip Down Memory Lane: 2009's Suffocating Pass Defense
Note: This is a series I've decided to put together to get us through the long months until football kicks off. It could be a season, a game, or one play. Hell, it could be anything that stuck out to me at some point in time about Iowa sports. Either way, just enjoy this trip back in Hawkeye history.
2009 was a special season. Though, it almost started off a nightmare, as Iowa needed two blocked field goals to beat the Panthers of Northern Iowa. The Hawkeyes started off the season 9-0 and made it as high as number 4 in the BCS. However, dreams of an undefeated season, and even a possible national championship birth, were shattered when Corey Wootton sacked Ricky Stanzi in the endzone, rolling his ankle underneath him. The Hawkeyes were still able to finish 11-2, and finished the season with a BCS Bowl win.
The team may have finished with only 2 losses, but it was far from a balanced team. This was a defensively dominating team, with a below average offense. Want to see just how unbalanced this team was? Let's take a look.

(What is this chart?)
The offense was below the Big 10 average in every category. You name it, they were not very good at it. The running game was especially terrible, as they were 32% below the Big 10 average in yards per carry and touchdowns per carry. The offense, however, did have some special moments. Namely, the Indiana comeback on Halloween and Stanzi to McNutt to beat Michigan State. But, make no mistake, this team was led by the defense.

The only category in which Iowa was below average on defense in, was tackles for loss ("Getting in the Backfield" on the chart), as I discussed in this post. Their 8.65% of opponent plays ending in negative yardage, was a solid number, that would have been around the Big 10 average in most years. There just happened to be a lot of teams that were good at bringing down their opponents behind the line of scrimmage that year. Other than that, Iowa abused their opponents on the defensive side of the ball in 2009.
They were 40% better than the Big 10 average at shutting down the run. 37% better than average at not letting their opponents score. In fact, they allowed only 13.08 defensive points per game (Points allowed by the defense only. Does not include touchdowns given up by offense or special teams), which was 9 points per game better than the Big 10 average. They even forced 17% more turnovers than average.
In other words, this defense ate opponents alive. The special part of the 2009 defense, though, may have been their ability to shut down opposing teams' passing attacks. Which is what these six long-winded paragraphs were leading into.
Visualizing a Football Team: Primer
If you've read this blog for a little while now, you've probably noticed that I like to use what Microsoft Excel calls "Radar Charts." Those would be those pentagonal charts that I used in all my game previews for basketball season. Well, I also use those for football too. I've gotten more readers lately, and I want to make sure that everyone who looks at these charts, knows what the hell I'm talking about. So, instead of breaking down how the chart works in every post that includes one, this post will serve as a primer to be linked to if you want to understand how they work. This will be the primer for football only. I will write a separate one for basketball later on down the road.
If you don't care about how I calculate these categories or what the categories actually measure, you can skip down to the "How to Read the Chart" section.
Anyway, let's get into it.
If you don't care about how I calculate these categories or what the categories actually measure, you can skip down to the "How to Read the Chart" section.
Anyway, let's get into it.
Wednesday, June 1, 2011
Looking at Tackles for Loss, and What that Could Mean for 2011's Defensive Line
People look at the roster for the upcoming football season, and everybody seems to come to the same conclusion: The biggest question mark is the defensive line. It's pretty clear to see why this seems to be the consensus, as Iowa lost three of their four starters from last year's defensive line to the NFL. Between the departed Ballard, Clayborn, and Klug, Iowa loses 43.86% of their tackles for loss from last year. If you look at just the tackles for loss by the defensive line, Iowa loses 62.50% of their tackles for loss from the 2010 season.
Iowa does get back Mike Daniels, who by himself, returns 19.30% of last year's tackles for loss (27.50% of last year's defensive line tackles for loss). Broderick Binns is also a year removed from a 9.5 tackles for loss season, with 5.5 of them being sacks. However, 2010 was a gigantic step in the wrong direction, as he came away with only 1 tackle for loss and no sacks. After those two, though, Iowa has some unproven guys with limited experience. Lebron Daniel, Dominic Alvis, and Steve Bigach only return 5.26% of last year's total tackles for loss between the three of them. So, you can see why people might be a little concerned about this year's front four.
Now, Mike Daniels could tear up the Big 10 and Broderick Binns could return to 2009 form. Iowa could also have a few of the guys with a little experience step up. For instance, someone like Carl Davis, Mike Hardy, or even Darian Cooper could prove to be Big 10 ready. But, how likely is that perfect scenario to happen? Well, if you look at Iowa's recent track record at dropping their opponent behind the line of scrimmage, probably not very likely.

The chart above shows the percentage of opponent plays that went for negative yardage in a season. Iowa struggled in this category last year, taking almost four more plays than the average Big 10 team to tally a tackle for loss. However, last year wasn't an apparition. Instead, it was part of a continuing trend for the Hawkeyes.
Sunday, May 29, 2011
Iowa Football Run/Pass Splits Since 2004
Now that I'm back from my trip to the former Yugoslavia, and my stomach is fully rested after consuming many liters of homemade sljivovica. It's time for me to get back into the swing of things. That means it's time for me to dig deep into some Iowa Hawkeyes numbers. Probably way deeper than is normal for any sane person. But, hey, I had two weeks pretty much cut off from the world. I'm well rested.
Anyway, for my first post back, I went back to 2004 to look at the Iowa Hawkeyes' run/pass tendencies under Kirk Ferentz. I only went back to 2004 because that is as far back as the Hawkeyesports.com's boxscores included the "play breakdown" section, which made this exercise easier than it would have been otherwise.
My main interest in looking at this, was that I wanted to see how Iowa under Ferentz, adjusted their offense based on what they have to work with from year to year. For instance, what does the Iowa play calling look like when they have a running back like Shonn Greene, as opposed to when Sam Brownlee is the man taking the majority of the carries?
A main limitation of this study, is the fact that not all box scores pointed out the difference between a quarterback who dropped back to pass and instead ran with the football, from a quarterback who took the snap and ran with the ball by design. Some box scores made this distinction, but most did not, which left me using things like down and distance to determine whether or not it was a called pass play or run play. For example, 3rd and 9, and Jake Christensen runs for 8 yards. It probably was not a designed run. Instead, it was probably the protection breaking down, and the quarterback scrambling for however many yards he could muster. The box score would count that as a running play, but I would call that a pass play, considering the coaching staff intended for that play to have the ball in the air. This makes my numbers look different from the numbers you would see if you looked up the run/pass splits from Hawkeyesports.com. My numbers aren't perfect, as I had to guess, but they are more accurate than the official websites numbers are.
Anyway, let's see the results.
Saturday, May 7, 2011
Comparing the First 12 Seasons of Hayden Fry and Kirk Ferentz: Different Styles, Similar Results?
Note: This will be the last post for a few weeks. I will be out of the country, and will not have much access to the internet. Hopefully, this post is plenty good enough to get you through the next two weeks.
Iowa football has been extremely fortunate to only have two different head coaches in the last 32 years. Not many college football programs can boast about such a thing. Both have been quite successful at the University of Iowa, despite doing things in pretty different ways. Hayden Fry, the man known for making Iowa respectable in football again, was very outspoken and would do anything to get inside his opponents head. He even went so far as to paint the opposing locker room all pink. Supposedly, to create a calming effect before his opponent took the field. Fry's successor, Kirk Ferentz, is the polar opposite. Ferentz is very tight lipped, giving stock answers to media questions, never giving his opponents bulletin board material. They are very different styles, but both have benefited from the way they do things.
Mostly out of needing an idea for a post, I decided to look at their success while at Iowa. Interestingly enough, they have had eerily similar success, despite their career arcs looking quite a bit different.
Like always, be warned. For there are graphs and numbers below. Ooooh. Scary. Continue if you dare!
Sunday, May 1, 2011
A Trip Down Memory Lane: Shonn Greene vs Purdue 2008 (aka the Frank Duong Game)
Note: This is a series I've decided to put together to get us through the long months until football kicks off. It could be a season, a game, or one play. Hell, it could be anything that stuck out to me at some point in time about Iowa sports. Either way, just enjoy this trip back in Hawkeye history.
2008 was Shonn Greene's season, and the rest of the Big 10 was just there for him to run through. Well, run through or run by. Because the 5'11 235 lb running back could also put a move on you too. Don't believe me? Ask Frank Duong. He witnessed firsthand these two talents that Greene possessed when Purdue visited Iowa City in November of 2008. While this game was awesome, it was probably Greene's second best effort of the year, as he had single-handedly demolished Wisconsin a month earlier. But, I chose this game to take deeper look at for a couple of reasons: 1) I was at this game, and Greene looked like a man amongst boys 2) He was basically Iowa's only offense on this day 3) This was his final game at Kinnick, and boy did he put on a show 4) Last but not least, from this game forward, I have referred to anyone who gets trucked in a game of football, as getting "Duong'd."
Before paying homage to Frank Duong, let's check out Greene's numbers from this game.
Carries Yards Yards Per Carry TD
30 211 7.03 2
Besides a 22 yard touchdown run by Jewel Hampton in the first quarter, Shonn Greene was the Iowa Hawkeyes offense that day. Going for over 200 yards on the ground and averaging more than 7 yards per carry.
This was Ricky Stanzi's first year under center, and he really looked like it. He finished the game with 72 yards passing on 15 attempts. Knowing that Greene was Iowa's best bet at picking up yards and running the clock down, Ferentz kept giving the ball to him. Iowa ran the ball 37 times, and, as you can see above, Greene received 81.08% of the carries, or 56.60% of Iowa's plays consisted of Greene carrying the ball. It was the kind of game plan that Kirk Ferentz seems to love: run the ball down the opponents throat, running the clock down, and then let your defense do it's thing. The nerve racking thing about it, from an Iowa fan's perspective, was that Purdue was keeping the game uncomfortably close (Thank God, Curtis Painter didn't play very much of this game).
Saturday, April 30, 2011
Ricky Stanzi's Place In Modern Hawkeye QB History
Iowa has built up a reputation as an NFL factory over the past couple of years. NFL coaches, executives, and even the so called "experts" talk up Kirk Ferentz as one of the best at getting college kids ready to be NFL players. Iowa has had success putting offensive linemen, defensive linemen, tight ends, etc. into the professional ranks. However, there has been one position that Iowa has not had the same kind of luck with in recent years. Leading up to this year's draft, I'm sure Hawkeye fans have heard this fact ad nauseum: Iowa has not had a quarterback drafted since 1992. To be fair, nineteen years is a long time. Not to mention, that the last two Iowa quarterbacks were twelfth round picks, which obviously doesn't exist anymore. So, extending that back to 1987, when Mark Vlasic went in the fourth round, means that Iowa has not had a quarterback drafted in the first seven rounds of the draft in my lifetime. Well, Ricky Stanzi finally bucked that trend today, as the Chiefs picked him up in the fifth round. And let me be the first to say: It's about fucking time, Iowa.
With that out of the way, let's get down to what this post is really about. Where does Ricky Stanzi rank all time among modern Iowa quarterbacks (modern, in this case, being since 1970)? It's an interesting question to be sure. Stanzi had mediocre years during his Sophomore and Junior campaigns, leaving the Iowa faithful hoping that he would finally put it all together. Then, during his Senior year, Stanzi literally became "The Manzi." He went from being known as a fourth quarter comeback kid, to a complete four quarter quarterback. His first two years under center for Iowa, surely drag his career numbers down, but how far do his Senior numbers pull him back up Iowa's lists? Well, let's find out.
With that out of the way, let's get down to what this post is really about. Where does Ricky Stanzi rank all time among modern Iowa quarterbacks (modern, in this case, being since 1970)? It's an interesting question to be sure. Stanzi had mediocre years during his Sophomore and Junior campaigns, leaving the Iowa faithful hoping that he would finally put it all together. Then, during his Senior year, Stanzi literally became "The Manzi." He went from being known as a fourth quarter comeback kid, to a complete four quarter quarterback. His first two years under center for Iowa, surely drag his career numbers down, but how far do his Senior numbers pull him back up Iowa's lists? Well, let's find out.
Friday, April 29, 2011
Iowa Football Career Offensive Stats Since 1970
As you no doubt know, we're currently in the middle of the college football offseason. And like most Hawkeye fans, I tend to find myself a little bored at times. Especially, when you consider that I follow a baseball team that continuously finds new and more frustrating ways to suck at the game they get paid to play. To try and minimize my boredom, I usually find myself browsing through many different stat sites to try and find a little nugget of information that I never knew or hadn't realized before. If that nugget happens to be Hawkeye related and interesting enough, then I post it on here.
Well, I was perusing totalfootballstats.com the other day, when I found a leaderboard for career passing, rushing, and receiving stats dating back to 1970 for Iowa football. Needless to say, I found this awesome, and once I found out it was sortable by category, I nearly cried out of happiness. However, I realized it didn't give me every statistic I wanted or they didn't present it how I would like. For instance, they give you TD% and INT%, which tells you the percentage of pass attempts that were touchdowns and interceptions. However, I prefer to see those stats as in how many attempts, on average, it took a quarterback to throw a touchdown or interception. So, I decided to input the numbers into a spreadsheet of my own (thank god for text to columns!). This allowed me to add the stats that I wanted. Anyway, I uploaded the spreadsheet onto Google Docs, for those who like to play around with this sort of thing.
The link can be found at: Iowa Football Career Offensive Stats Since 1970
Note: If the columns are not already sortable, then click the filter button up top. You can also download it into Excel if you'd like.
As a quick example of what you can do with this, I present to you: The Worst 5 Iowa Quarterbacks Since 1970 in Attempts per Interception for the Iowa Hawkeyes (min. 100 attempts):
So, there you go. I think you get the point. Hopefully, you will enjoy this as much as I have so far. If you get nothing else out of this, though, at least you can be the life of the party, when you tell your friends that Arvell Nelson has the highest quarterback rating in the last four decades of Iowa football.*
*Arvell Nelson- 1 Game, 1-1, 12 yards, 0 TD, 0 INT, 200.80 QB Rating. Small sample sizes!
Follow Me on Twitter: GoHawks1123
Well, I was perusing totalfootballstats.com the other day, when I found a leaderboard for career passing, rushing, and receiving stats dating back to 1970 for Iowa football. Needless to say, I found this awesome, and once I found out it was sortable by category, I nearly cried out of happiness. However, I realized it didn't give me every statistic I wanted or they didn't present it how I would like. For instance, they give you TD% and INT%, which tells you the percentage of pass attempts that were touchdowns and interceptions. However, I prefer to see those stats as in how many attempts, on average, it took a quarterback to throw a touchdown or interception. So, I decided to input the numbers into a spreadsheet of my own (thank god for text to columns!). This allowed me to add the stats that I wanted. Anyway, I uploaded the spreadsheet onto Google Docs, for those who like to play around with this sort of thing.
The link can be found at: Iowa Football Career Offensive Stats Since 1970
Note: If the columns are not already sortable, then click the filter button up top. You can also download it into Excel if you'd like.
As a quick example of what you can do with this, I present to you: The Worst 5 Iowa Quarterbacks Since 1970 in Attempts per Interception for the Iowa Hawkeyes (min. 100 attempts):
- 1) Tom McLaughlin (1975-1977)- 12.33
- 2) Butch Caldwell (1972-1976)- 12.88
- 3) Kyle Skogman (1970-1973)- 13.89
- 4) Pete Gales (1978-1981)- 15.80
- 5) Rob Fick (1971-1974)- 16.15
So, there you go. I think you get the point. Hopefully, you will enjoy this as much as I have so far. If you get nothing else out of this, though, at least you can be the life of the party, when you tell your friends that Arvell Nelson has the highest quarterback rating in the last four decades of Iowa football.*
*Arvell Nelson- 1 Game, 1-1, 12 yards, 0 TD, 0 INT, 200.80 QB Rating. Small sample sizes!
Follow Me on Twitter: GoHawks1123
Saturday, April 23, 2011
A Trip Down Memory Lane: Tavian Banks' 1997 Season
Note: This is a series I've decided to put together to get us through the long months until football kicks off. It could be a season, a game, or one play. Hell, it could be anything that stuck out to me at some point in time about Iowa sports. Either way, just enjoy this trip back in Hawkeye history.
Ah. 1997. I remember it just like it was yesterday. Actually, no I don't. Considering when the Hawkeyes kicked off the 1997 season, I was 3 months away from my tenth birthday, I don't remember a whole lot from that season. Here's what I do remember from that time period: 1) Tavian Banks was Awesome. 2) Tim Dwight was awesome. This post, however, is about the former rather than the latter. (I'll probably do a Dwight post at some point too).
Tavian Banks was my favorite player as a kid. Why? Well, this can probably explain why. He was a playmaker. Banks was more of a finesse runner, he wasn't going to bowl you over. But, his combo of great vision and speed, allowed him to make one cut and leave everybody in a cloud of dust. Every time he touched the ball, 9 year old me looked on in awe, because I knew there was a chance that something spectacular could take place.
Banks' career at Iowa had a bit of bad timing, however. The high school star, who chose Iowa over offers from Nebraska, Washington, and Miami, to name a few, attended Iowa during the same period that another very good running back was carrying the ball for the Hawkeyes. Sedrick Shaw and Tavian Banks were quite the one-two punch, going for over 1,500 yards on the ground combined in 1995 and over 2,000 in 1996. However, Shaw got the majority of the carries (316 to 66 in 1995 and 224 to 144 in 1996) during the time period that they were teammates.
When Shaw was drafted in the third round of the NFL Draft, Banks finally got his chance in 1997 to show what he could do as the number one running back. He didn't disappoint. His final line for the year looked like this:
Games Carries Yards TD YPC YPG Carries Per TD
11 260 1691 17 6.50 140.92 15.29
The former football and soccer star from Bettendorf, had gotten the most carries of his collegiate career and put up his best average yards per carry on top of it. Not to mention, he also set the Iowa single season record for rushing yards and touchdowns, which would stand for a little over a decade, when Shonn Greene would break them.
Banks had finally got his chance to be the number one guy during his Senior year, and he took the opportunity and ran with it. Literally. Since I'm not much of a writer, I didn't write this to be just a narrative on Tavian Banks career. I'm more interested in how good he was. In other words, the numbers. So, let's take a look at the damage Banks did to opposing teams during his 1997 campaign. Shall we?
Thursday, April 7, 2011
2010-2011 Offensive and Defensive Efficiency for the Big 10
Mostly out of boredom (long ways off until football season), I decided to make a chart. What you will see below, is all Big 10 teams plotted by their Adjusted Offensive and Defensive Efficiency. For those who aren't familiar with Offensive and Defensive Efficiency, they're basically points per possession multiplied by one hundred. They're tempo-neutral stats that you can compare to points per game. They allow you to compare how many points a team averages or allows in one hundred possessions. I used Adjusted Offensive and Defensive Efficiency from kenpom.com. The "Adjusted" part is just kenpom's way of adjusting for things I'm not smart enough to do, like strength of opponent.
I scaled them all so that 100 on each axis equals Big 10 average (The average offensive efficiency in the Big 10 this year was 113.56. For defense, 94.04). Anything above 100 is above average and anything below 100 is below average. For instance, 90 = 10% below average and 110 = 10% above average.
Enough stat speak. Lets get to it!

Above Average Offense and Defense:
- Ohio State- Offensive Efficiency- 125.6 (11% above average), Defensive Efficiency 88.4 (6% above average). They were by far and away the best team in the Big 10 this year. They dominated on both sides of the ball.
- Purdue- Offensive Efficiency- 115.3 (2% above average), Defensive Efficiency 89.5 (5% above average). Purdue was very good on both sides of the ball. However, because they only had two real offensive options most of the time, they were only 2% above average on offense.
- Wisconsin- Offensive Efficiency- 123.3 (9% above average), Defensive Efficiency 95.2 (1% below average). The Badgers were very good on offense, only slightly worse than Ohio State. On defense they were simply meh.
- Northwestern- Offensive Efficiency- 115.5 (2% above average), Defensive Efficiency 99.7 (6% below average). Northwestern was a good offensive team and an atrocious defensive team (worst in the Big 10!). I know. I was shocked by this result too.
- Illinois- Offensive Efficiency- 112.7 (1% below average), Defensive Efficiency- 91.0 (3% above average). Illinois just edges out Michigan, as they were both pretty much even on offense, but Illinois was 2% better on defense.
- Michigan- Offensive Efficiency- 112.8 (1% below average), Defensive Efficiency- 93.0 (1% above average). Michigan was about as average as average could get this year.
- Michigan State- Offensive Efficiency- 109.1 (4% below average), Defensive Efficiency- 92.6 (2% above average). Michigan State was right in-between Illinois and Michigan on defense, but they were much worse on offense.
- Penn State- Offensive Efficiency- 112.9 (1% below average), Defensive Efficiency 95.5 (2% below average). I was kind of surprised that with Talor Battle and Jeff Brooks on their team, Penn State wasn't at least slightly above average on offense. The defense didn't surprise me one bit, however.
- Minnesota- Offensive Efficiency- 109.4 (4% below average), Defensive Efficiency- 95.6 (2% below average). When you have Blake Hoffarber trying to play point guard for a portion of the season, you know it's not a good year.
- Iowa- Offensive Efficiency- 103.6 (9% below average), Defensive Efficiency- 94.8 (1% below average). Iowa sported the worst offense in the Big 10 this year. On the bright side, the Hawkeyes' defense was only slightly below average.
- Indiana- Offensive Efficiency- 109.0 (4% below average), Defensive Efficiency- 99.1 (5% below average). Indiana and Iowa were on a whole different level of sucktitude in the Big 10 this year. However, Indiana couldn't beat Iowa this year. So, suck it Hoosiers! We're number 10!
Sunday, April 3, 2011
A Mid-Season Look at the Iowa Baseball Team: Part II
This time, pitching!

Note: Once again, the stats from this post are through March 31 only. No Big 10 games are included in this data.
That looks a lot better than the offense. Now, Iowa's pitchers aren't what you would consider world beaters. However, they do get the job done. The most important thing in any sport is scoring and keeping the other team from scoring. Well, Iowa's pitchers have been decent at keeping runs off the board. Iowa's 5.22 R/9 allowed is 4% better than the league average of 5.42.
A big part of Iowa's ability to keep runs off the board has been keeping the ball in the park. Iowa's 0.27 HR/9, is third in the Big 10, and good for 18% above the league average of 0.33. As mentioned in the first post, Duane Banks Field should also help with this.
When it comes to strikeouts and walks, however, Iowa is below average. Iowa's 6.21 K/9, is 3% below the Big 10 average of 6.42. While, their ability to find the strike zone is a little worse, as their 4.23 BB/9 is 9% worse than the league average of 3.87.
Iowa's pitching graded out overall to 2% above average when taking into account all four scores from above. Their score of 102, tied Illinois for fourth best in the Big 10. Basically, Iowa has a bunch of pitchers who don't miss a lot of bats, walk too many guys, but keep the ball in the park, which keeps runs off the scoreboard. It may not be the prettiest, but it can get the job done. Kind of.
Saturday, April 2, 2011
A Mid-Season Look at the Iowa Baseball Team
I love Baseball and I love the Iowa Hawkeyes. However, I follow Football and Basketball much closer than I do the Iowa Baseball team. Most of that is because they are rarely on TV. It also doesn't help that they haven't been historically good at the game, and this year hasn't been an exception so far.
Well, lately I've been thinking about ideas for a post on here, and finally the inspiration hit me. I was walking around Scheel's last weekend, and I saw this awesome Iowa Baseball shirt. I decided to buy it. I then thought to myself, I'm going to wear this and know close to nothing about the how the current team is doing this year. So, I decided to write about the Baseball season so far. One, so in case anybody asked me about my shirt, I could actually sound knowledgeable about the team. Two, because I actually would like to care about Iowa Baseball, more than I do now.
So, for this post the numbers are through March 31 only. None of the Big 10 games played yet are in here. In this post, I'll be looking at offense only. Tomorrow will be pitching. Let's go!
Offense:
 This is how Iowa's bats stack up to the Big 10 average. Not very good. Iowa is 5% below average at getting on base (OBP). Iowa as a team gets on base at a .344 clip, compared to the .362 league average OBP. They are also 43% below average in the power category, which I measured by Isolated Power (ISO). For those not familiar with ISO, it is simply Slugging Percentage (SLG) - Batting Average (AVG). It gets rid of the singles a player hits, leaving you with the average extra bases per plate appearance for a hitter. The Hawkeyes ISO is a measly .056, compared to the Big 10 average of .099. Iowa is also 22% below Big 10 average in scoring runs (Runs per 9 innings). Iowa is scoring 4.30 R/9 this year, while the average Big 10 team is scoring 5.50. They are, however, 4% above average when you look at their strikeout to walk ratio (K:BB). Iowa averages 1.75 strikeouts for every 1 walk. The Big 10 average is 1.82 K:BB.
Look at Iowa's triple slash line: .247/.344/.303. Now look at the average Big 10 team: .281/.362/.380. That is why Iowa's offensive scores on the above chart averaged out to an offense that is 17% below the Big 10 average.
Well, lately I've been thinking about ideas for a post on here, and finally the inspiration hit me. I was walking around Scheel's last weekend, and I saw this awesome Iowa Baseball shirt. I decided to buy it. I then thought to myself, I'm going to wear this and know close to nothing about the how the current team is doing this year. So, I decided to write about the Baseball season so far. One, so in case anybody asked me about my shirt, I could actually sound knowledgeable about the team. Two, because I actually would like to care about Iowa Baseball, more than I do now.
So, for this post the numbers are through March 31 only. None of the Big 10 games played yet are in here. In this post, I'll be looking at offense only. Tomorrow will be pitching. Let's go!
Offense:

Look at Iowa's triple slash line: .247/.344/.303. Now look at the average Big 10 team: .281/.362/.380. That is why Iowa's offensive scores on the above chart averaged out to an offense that is 17% below the Big 10 average.
Tuesday, March 22, 2011
2010-2011 Season in Review: Devon Archie
At 6'9" 225 lbs, Devon Archie looks like a man that was born to play basketball. He has long arms and a very good vertical for a guy his size. However, that athletic ability hasn't quite translated into basketball talent. He's like that prospect in every baseball fan's farm system, that has the tools to be a good player but he just never develops. He is like the prospect that can hit the ball a mile long when he makes contact, the problem is he doesn't make contact very often. For those very knowledgeable in baseball, Archie is like Greg Halman (Mariners farm system, Google him if you don't know).
Archie will be a redshirt Senior next year, and after four years of college ball (two years at Iowa), the only thing that has developed is his knack for grabbing rebounds. In his 8 minutes per game this year (only 23 games played), Archie pulled down 24.87% of the opposing team's misses, and corralled 18.06% of Iowa's misses. Those are pretty insane rebounding numbers, even if they are only in 8 minutes stints. Other than the rebounding, Archie has flashed the ability to make a nice post move or block a few shots, but nothing real consistent. Going into next year, Archie is probably a bigger question mark than Brommer is. Like I mentioned with Marble and May, Archie has the tools, he just needs to put them together. The difference is, that unlike the other two, who have multiple years remaining, Archie only has next year to do it.
Strengths:
- Rebounding- This is the biggest tool in Archie's arsenal. The problem is, that only playing 8 minutes per game limits him from racking up more than about 2 or 3 rebounds per game. If he would have put up the same defensive rebounding rate and offensive rebounding rate, but played more minutes per game, Archie would have finished first in the Big 10 in offensive rebounding and third in defensive rebounding. If he were to increase his minutes to 20 minutes per game, and still grab rebounds at the same 0.36 rebounds per minute pace, he would average 7.17 rebounds per game. That would be pretty valuable for Iowa. The main question is can he do enough in practice, to make Fran get him some playing time? Because his rebounding ability is pretty useless on the bench.
- Free Throw Shooting- Saying Archie is bad at shooting free throws is an understatement. A more descriptive adjective would probably be something more like horrendous. Of his 23 attempts from the free throw line this year, he made only 6 (26.09%). Even more than that, he also had two airballs from the free throw line. One in partciular, I think during the last game vs Purdue, he had one that not only came up short of the rim, but it looked to be wide right of the rim also. If I remember correctly, it was so bad that it made Sportscenter's Not Top 10. Ummm.... So, yeah. Work on that Devon.
Monday, March 21, 2011
2010-2011 Season in Review: Andrew Brommer
Andrew Brommer is a bit of an enigma. For every 12 point, 6 rebound, and 3 block game like he had at Ohio State this year, there were ten games similar in nature to the 2 point, 2 rebound, 2 block, and 5 foul game like he had at Michigan State. Then you have his season stats, which are just as enigmatic. Brommer's 56.94% eFG%, was second best on the team. His 0.25 points per minute, however, was second to last on the team. His offensive rebounding rate of 8.87% was pretty good, finishing nineteenth in the the Big 10. His defensive rebounding rate of 13.97%, on the other hand, was twenty eighth in the Big 10. Brommer actually showed a pretty good talent for finding the cutter in the lane, as he had a decent assist rate for a big man, at 11.1%. Unfortunately, he also showed a pretty good talent for giving the ball to the other team, as his 28% turnover rate was third worst in the Big 10. Add to all of that, the fact that he had major fouling problems this year, and you see why he was an enigma. Basically, for every good thing Brommer did, he also had one equally or worse bad thing that he did. Which, leaves Iowa fans wondering what they can expect from him next year, when he will most likely need to step into a bigger role. Brommer's senior year will be now or never, and I hope the answer is now.
Strengths:

Strengths:
- Shooting- Brommer went from a 38.4% eFG% (10-26 FG) last year, to a 56.9% eFG% (41-72 FG) this year. Brommer's shooting was helped by the fact that he took 55 shots in the paint, where he just so happened to shoot 67.86% on field goal attempts from there. Unlike, like some other players on the team, Brommer actually played to his strength this year.
- Offensive Rebounding- Brommer's offensive rebounding rate has taken a step forward every year since his freshman year. This year he pulled down 8.87% of all available missed shots by Iowa this year, while he was on the court. That number is not great, but it's decent. The reason I put it in strengths, is because since it has increased every year, it's pretty realistic to think that it could jump up to about 10% next year. For reference, Jarryd Cole had a 10.63% offensive rebounding rate this year. If Brommer can get that up to about 10%, and keep himself in the game for longer than the 12.52 minutes per game he averaged this year, then he could be a nice asset on the offensive glass next season.
- Turnovers- I've already mentioned in a few of these posts, that Iowa was a turnover plagued team this season. Well, Brommer was the most turnover prone player on the turnover plagued Hawkeyes. His 28% turnover rate was third worst in the Big 10 this season. If you take the non-conference games out of the picture, then Brommer's 33.3% turnover rate (!) was the worst in the Big 10. It wasn't just worse by a little, either. He was almost 3% worse than the number two player, who just so happened to be Iowa's own Zach McCabe (We so dominated at turning the ball over this year). If you go beyond Iowa's turnover twins, Brommer was worse than Keith Appling by almost 5%. Also, unlike his offensive rebounding rate, Brommer's turnover rate is trending in the wrong direction. In Brommer's freshman year, he had a 22.5% turnover rate. That increased to 25% his sophomore year, and then to 28% this year. Knock it off, Andrew.
- Free Throw Shooting- He wasn't the worst on the team (it's hard to be worse than Archie at free throws), but he was the second worst free throw shooter for Iowa this year. In 33 free throw attempts this year, he made only 14 (42.42%). If you want another example of Brommer being enigmatic, well then look at his free throw shooting. His freshman year, he made 5 of his 22 free throw attempts (22.7%). During his sophomore campaign, he made 18-24 from the line (75%). He then built off of that good showing, by going 14-33 this year. So, who knows what the hell he'll do next year? He could go 30-40, or he could go 18-40. Neither would surprise me.
- Fouling- To get an idea of how much of a fouling problem, Brommer had this year, one should look at his stats adjusted to 40 minutes per game. If a Brommer were able to play a full 40 minute game, and continued to foul at the same rate, he would average 6.80 fouls per game. Technically, he wouldn't actually be able to reach 6.80 fouls per game, as he would have fouled out just before the 30 minute mark (29 minutes and 23 seconds to be more precise). But, to get an idea of how often he fouled the opposing team, here is a graph comparing his fouls per 40 minutes to other stats he would compile in the same amount of time:

Sunday, March 20, 2011
2010-2011 Season in Review: Zach McCabe
Unlike fellow freshman Devyn Marble, whose playing time increased as the competition got tougher (Thanks in part to Eric May). Zach McCabe's playing time went the opposite direction as Big 10 play started. Here's a handy graph:

Now, McCabe is sort of a "tweener." He lacks the ideal height for a power forward and the athleticism for a small forward. So, he goes back and forth between positions on the court. As Basabe and Marble's playing time increased, and May's never dipped below 20 minutes per game, there was less playing time left for the struggling McCabe.
Though, his season may not have ended the way he would have liked it, McCabe did show some promise. He flashed some shooting ability from downtown at times (when he was on he was on, but when he was off....) and he was also a pretty good rebounder. He didn't have a great season overall, but he was only a freshman. With some more development, McCabe definitely has the talent to be a very good role player for Iowa for the next couple of years.
Strengths:
- Rebounding- McCabe's 15.25% defensive rebounding rate and 6.64% offensive rebounding rate, finished the season right between Iowa's post players and wing players. He was nestled nicely between Brommer and Marble. His defensive rebounding rate was good for twenty second in the conference. While, his offensive rebounding rate was good for twenty sixth in the conference. Both numbers are pretty good when you consider that McCabe spent a lot of time out behind the arc.
- Free Throw Shooting- McCabe was easily Iowa's second best shooter from the free throw line this year. His 80.43% free throw percentage was only worse than Gatens' on the team, and was better than third place by about 9%. If there was one thing that McCabe was consistent in shooting this year, it was free throws.
- Shooting- McCabe made only 51.02% of his shots in the paint. Easily, worst on the team by about 10% (team average = 68.86%). McCabe also made only 28.57% of his three point attempts (team average = 31.40%). As you will see later, both of these categories took a huge hit when McCabe started playing against Big 10 opponents. Overall, his 42.01 eFG% was pretty underwhelming. Let's hope this improves next year.
- Turnovers- McCabe, like most freshmen, had a bit of a turnover problem. His 24.3% turnover rate was tenth worst in the Big 10 this year. However, Andrew Brommer and Eric May were even worse this year. That's right. Iowa had three players in the top 10 at coughing up the ball this year. If you want to expand it to the worst 15, Iowa adds Cartwright and Basabe to the mix. That's 33.3% of the top 15. Easily the best. Yay! We won at something!
Saturday, March 19, 2011
2010-2011 Season in Review: Devyn Marble
Devyn Marble, as everybody knows, is the son of the all time leading scorer in Iowa Men's Basketball history. However, coming out of high school, Devyn (Roy Jr.) wasn't as heralded as his father was. Instead, he came to Iowa as a developmental guy. He's long and athletic, but he still needs a lot of polish. The potential is there, though. You can see it flash at times (ex: Iowa's first game vs Indiana, and second game vs Michigan).
On most Big 10 teams, Marble would have redshirted. But, Iowa's lack of depth, did not allow McCaffery the option of putting the redshirt on him. So, to start the season, Marble was Iowa's back up shooting guard to Matt Gatens. Then Cully Payne went down to injury, and Marble became Iowa's back up point guard too. He performed about as well as you could ask from him, playing a position that he was clearly not suited for. He wasn't good, but he wasn't horrible (ex: Purdue game when Cartwright was injured). And really, that that sums up Marble's season in one sentence. He wasn't good, but he wasn't horrible either.
Strengths:
- Shooting in the Paint- Notice how I said "in the paint." Marble was one of the worst shooters on the team this year, but when it came to scoring in the paint, he was one of the best. He took 41 shots inside the paint this year, and connected on 32 of them. His 78.05% FG% in the paint was second on the team to Jarryd Cole.
- Defense- This is based more on potential, than actual results. In reality, Iowa had a bad defense this year. But, at the end of the year, when Marble was inserted into the starting lineup, Fran made it a point to put him on the opposing team's best scorer at times. He wasn't always successful, as guys like Darius Morris could tell you, but he was better than the other options. Cartwright is good at a lot of things, but defense is not one of them. Gatens is a pretty good defender at times, but his lack of foot speed regularly got him beat on back door passes this year (ex: Northwestern) Eric May, well, does anybody know what went on with him this year? All three of those problems, left Marble looking like the best option for Iowa on defense. What did Marble bring to the table? Well, Marble has a lot of upside on defense. He's a quick enough to stay with athletic wing players, and also has long enough arms to help keep his man in front of him. I'm not saying he will develop into a lockdown defender, but he can definitely be a good one down the road.
- All Other Shooting- Once Marble starts moving away from the basket, he becomes a very inefficient shooter. He made only 25% of his two point shots outside of the paint (team average = 28.17%) and 26.83% of his three point field goal attempts (team average = 31.40%). You can even add free throw shooting to this category. Marble only made 53.03% of his free throw attempts this year (team average = 67.55%). That was better than only Devon Archie (26.09%) and Andrew Brommer (42.42%), which is not at all a compliment. Marble was easily the worst on the team by a wing player, as Eric May was the next worst, shooting 60.38% from the charity stripe. Now, all of this is not to say that Marble won't get better. I certainly expect him too, as he was only a freshman this year. But, this is to say, that he needs to do a lot of shooting this offseason.
Wednesday, March 16, 2011
2010-2011 Season in Review: Jarryd Cole
On a young Iowa Hawkeye team, Jarryd Cole was the lone Senior in the starting lineup. Considering Cole's story is probably fresh in your mind from the lead up to the Senior Day game against Purdue, I won't repeat it. That isn't what this post is about anyways. This post is to review his Senior year, which turned out to be a pretty good one.
It began a little shaky in November, as he started the season with an injury (foot?), which led to him playing only 18.86 minutes per game. However, even with limited playing time, he still averaged 0.32 points per minute in November, while grabbing a 5.71% offensive rebounding rate and a 18.23% defensive rebounding rate. In December, Cole's playing time increased, his points per minute stayed steady, and his rebounding exploded. His offensive rebounding rate for the month was an insane 22.92% (small sample sizes, but wow!), and his defensive rebounding rate was 23.89%. He was at the top of his game.
Then January came, and Cole went silent. His offensive rebounding rate fell back down to around 5%, and his defensive rebounding rate came down to an okay, but not great 14.66%. Not to mention, his points per minute fell to 0.24 (yikes!). I was a little worried, thinking that the tougher competition was getting the best of Cole. No worries, though, as he just needed the Calendar to turn. In February/March, his points per minute shot up to his best of the year, topping out at 0.36. It was partially due to a little good luck, as he shot an unsustainable 64.18% eFG% in those ten games (small sample sizes!), but he was still good. His offensive rebounding rate in February/March, was a more realistic 9.39%, as was his 20.09% defensive rebounding rate (both very close to his season averages). Even though Cole had some rough spots this season, he was still one of the most dependable players on the team. Especially, down the stretch.
Strengths:
- Rebounding- With a 10.63% offensive rebounding rate, that was good enough for ninth best in the Big 10. Not to mention, a 19.25% defensive rebounding rate, that finished eighth in the conference. It's pretty safe to say that rebounding was a strength for Cole. Basabe and Archie were the two best rebounders on the team, but Cole wasn't too far behind. He actually outperformed Basabe on the defensive boards in December and February/March. So, he definitely deserves some credit.
- Getting to the Free Throw Line- Not including Devon Archie, who only attempted 32 field goals this year, Cole led the team in free throw rate (free throws attempted per field goals attempted). On the year, he took 93 free throws compared to 162 field goal attempts, good for a 0.57 free throw rate. Never once, did he drop below 0.42 for any month (team average = 0.34). In fact, in December he had a ridiculous 0.86 free throw rate. He attempted 25 free throws compared to 29 field goals. Just to see crazy his December was, here's a graph:

- Shooting- Even though Cole isn't known for his scoring ability, he was actually a very efficient scorer. He finished his career with 59.60% eFG% (never dipping below 56.7% in his four years at Iowa), and he averaged 1.20 points per scoring attempt this year (second best on the team). I should also mention, that his 78.41% FG% on shots in the paint was the best on the team, and his 31.51% FG% on two point shots outside the paint was second on the team, behind only Gatens. Just for reference, the team average FG% on shots in the paint was 68.86% and 28.17% for two point shots outside the paint. Have I made Jarryd's case yet? He was a pretty damn good shooter.
- Blocks- This is probably nitpicking, and I'm not saying he wasn't good on defense. I don't recall yelling at my TV because Cole had some mental lapse on defense. He actually looked good on defense, mostly because he had a big physical body, that could bang with the bigger post players. However, he was an undersized center. So, it probably isn't that surprising that he was not that great at rejecting opponents shots. But, considering he never topped a 2% block rate his entire career at Iowa, is kind of surprising to me. Blocks aren't a huge deal, but Cole's game was pretty well-rounded during his Senior year. He wasn't a huge scoring threat, but he was never seen as the top scoring option on the team. He also cut his turnovers this year, by a lot. And so he didn't really leave much for me to complain about. Feel free to let me know if I'm missing anything, but I think Cole had a very nice Senior season.
Tuesday, March 15, 2011
2010-2011 Season in Review: Melsahn Basabe
Make no mistake. Melsahn Basabe looks to be a star. I still find it hard to believe that if Fran McCaffery hadn't been hired at Iowa, Basabe could have been dominating the MAAC last year. Instead, he was dominating the paint in one of the toughest basketball conferences in Division I. Iowa fans knew Basabe had some talent when he showed up in Iowa City and dominated the Prime Time League. Not that the Prime Time League is necessarily something you want to evaluate a player off of, as defense is not of much importance in the "pick up" style games that are played. So, expectations were still pretty tempered for Basabe coming into his freshman campaign. This is where his season became pretty much the opposite of Eric May's.
November was a pretty good month for Basabe, as he averaged 0.35 points per minute on a 54.29% eFG%. He also had a 10.19% offensive rebound rate and 21.43% defensive rebounding rate. If he kept those numbers up all season, nobody could have complained. Those are solid numbers, especially for a true freshman. However, Basabe wasn't fine with those numbers. Instead, he decided to up his scoring, shooting, and offensive rebounding. He finished the season averaging 0.45 points per minute (best on the team) on a 57.21% eFG% (also best on the team), pulling down 13.29% of all offensive and 19.83% of all defensive rebounds available while he was on the court. Those were his numbers as a freshman. Let me say that one more time. Basabe was only a freshman this year. If he keeps this up, he is going to be one of the best players to ever put on an Iowa jersey.
Strengths:
- Scoring- Basabe was the best on the team at putting the ball in the basket this year. His 0.45 points per minute, was tied with Trevor Mbakwe for number 12 in the Big 10 this year. However, if you cut that list down to freshmen, Basabe came in fourth, behind only Ohio State's Jared Sullinger and Deshaun Thomas, and Michigan's Tim Hardaway Jr. Need I say more? Well, one more thing. A graph!

- Shooting- Not only did Basabe put the ball in the hoop at a fantastic rate. He also did it very efficiently. As I mentioned in the intro, his 57.21% eFG% was the best on the team. Not to mention, his 1.21 points per scoring attempt was also number one on the team this year. Whenever Basabe put's a shot up, especially in the paint, it's going to drop more often than not.
- Rebounding- Basabe was the best rebounder on the team, who actually played a majority of the games (Archie was a rebounding machine when on the court). His 19.83% defensive rebounding rate finished sixth in the Big 10. His 13.29% offensive rebounding rate finished third in the Big 10. However, during conference play, Basabe stepped it up and came away with a 15.27% offensive rebounding rate, which was the best in the Big 10. Yeah. He was only a freshman.
- Blocks- When you look at Basabe, one of the things you notice about him is his long arms. The man has a pretty good wingspan. So, it should not come as any surprise that he was one of the best in the conference at swatting away opponents shots this season. Basabe blocked 6.08% of all opponents shots, while he was on the court last year. That was good enough for fifth in the conference, behind only Dallas Lauderdale, Ralph Sampson III, Mike Tisdale, and JaJuan Johnson. Pretty good company, eh?
- Turnovers- Basabe had a bit of a problem giving the ball to the other team this year. His 22.1% was sixteenth worst in the conference. While it wasn't as bad as some of his teammates, it's still too high. A lot of times his turnover problems came from reacting way too late to double teams. The game at Illinois springs to mind. He needs to realize that other teams know that he is Iowa's best player. That means that he is going to see double teams when he catches the ball. He needs to get rid of the ball before that second man comes over and tries to trap him. Whether, that means him making a quick post move and putting up a shot, or kicking the ball out to an open teammate on the perimeter. The good news is, he has plenty of time to fix this.
- Fouling- I could have labeled this inconsistency, as usually when he had his worst game, it was because he got in early foul trouble and took himself out of the game. When you get two fouls in the first half, you know Fran is going to yank you. Basabe is one of the the last players, that Iowa can afford to see come out of the game early. When he can string the big games together, without having one or two where he takes himself out of the equation, that will be when he takes the next step. Once again, he's young. He'll learn with experience.
Monday, March 14, 2011
2010-2011 Season in Review: Eric May
Eric May's season could probably be summed up by this one graph:

Thanks for reading. See you next time. Kidding. But, this season was pretty much a nightmare for Eric May. I remember before the season started, there were people predicting he would have a breakout season and end up the best player on the team. Well, they would have been right, had the season only lasted one month and ended in November. Because once December started, May fell off a cliff, and just kept falling until the end of the season. His big November was largely the result of an unsustainable 60.42% eFG%. His eFG% came back down in the following months: 40.38% in December, 44.44% in January, and 42.71% in February/March. As May's shots stopped going in the basket as much, he looked like he started to lose confidence in his game. This led to May taking fewer and fewer shots per game. Let's see, taking fewer shots and making fewer shots, doesn't seem like a great recipe for success. Yet that's exactly what happened with Eric May. Now, this offseason becomes crucial for May, as he tries to fix whatever the hell went wrong this year.
Strengths:
- Athleticism- May is one of the best athlete's on the team (I say "one of" because Basabe and Archie are pretty damn athletic too). Every Iowa fan sits on the edge of their seat when Eric May gets out in front on a fast break. The anticipation of his thunderous dunks are almost as exciting as the dunks themselves. His athleticism also allows him to be one of the best guys on the team at creating his own shot. May tied Marble this year, for third on the team in creating their own shot, as 50% of his field goals were of the unassisted variety. May is a raw talent. He's the guy that just oozes athletic ability, and you hope he can be developed into a complete basketball player.
- Turnovers- May finished the season ninth worst in the Big 10 in turnovers, with a 24.7% turnover rate. What's really disappointing about that number, is that it is about 4% worse than his freshman year, where he had a turnover rate of 20.4%. Iowa, as a team, had a big turnover problem this year. Eric May was just a small part of it. Which means, this isn't the last you will hear of turnovers in the weakness column.
- Free Throws- May took almost the same exact number of free throws this year (53), as he did last year (57). However, he made about 6% less of them this year (32 compared to 38). His 60.4% free throw percentage trended the wrong way this year. Hopefully, next year it well trend back toward 70%.
Sunday, March 13, 2011
2010-2011 Season in Review: Matt Gatens
Gatens had an up and down year. Before the season started, in October, Gatens injured his thumb. As a result, he missed the first two games of the season. When he returned, he was clearly not healthy. His injured thumb caused him to average 0.33 points per minute (8.20 points per game) shoot a 33.33% eFG%, and connect on only 21.05% of his three point attempts. When December rolled around and his thumb was feeling better, Gatens went off. He averaged 0.45 points per minute (16.17 points per game) on a 58.57% eFG%, and making 36% of his three point attempts. In January, he improved to 41.86% from behind the arc, but his points per minute dropped to 0.39 (13.50 points per game) as he saw more difficult competition. Still good, though.
However, the ten games in February and March, weren't particularly kind to Gatens. His three point percentage took a dive, falling to 27.45%. His eFG% was still a decent 45.63%, but because of his shooting dip, his points per minute fell to 0.34 (12 points per game). Very similar to his 0.33 mark he put up in November when he was injured. Gatens finished the season shooting 33.1% from downtown, and making many fans wonder what happened to the player who hit 40.3% of his three point attempts during his freshman year. It was a solid year from the lifelong Hawkeye (he did average 12.62 points per game), but it still left a lot of people questioning whether or not he was overrated.
Strengths:
- Scoring- Gatens took a step forward scoring-wise this year. His 0.38 points per minute was up from his 0.32 his freshman year and his 0.33 his sophomore year. It's even more impressive, when you consider he put up the equivalent to his sophomore average of 0.33 points per minute, in November, when he shot very poorly because of his injured thumb. Even when he's injured, he will still put points on the board.
- Outside Shooting- A lot of people are down on Gatens' shooting this year. His 48.4% eFG% was better than his Sophomore campaign (45.5%), but worse than his Freshman campaign (52.3%). His three point field goal percentage was the same way: 33.1% this year, compared to 32.8% last year and 40.3% his freshman year. However, the injury and the cold streak he was on during the last month of the season really hurt him. In December and January, Gatens shot 38.71% from long range, which is much closer to that 40% mark that everybody has been waiting for Gatens to repeat. If Gatens hadn't been hurt in the first month, his overall three point percentage probably would have been much better, and would have been able to withstand the terrible February and March that he had shooting the three. Not to mention, that his 37.04% FG% on two point attempts outside the paint was the best on the team. When you consider that Iowa, as a team, shot 28.17% from out there, Gatens looks very good. The guy is a shooter.
- Free Throws: Gatens 87.36% free throw percentage is almost 7% better than Zach McCabe's, who is number two on Iowa. I should also mention that Gatens finished number one in the Big 10 in this category for the second time in his three year career. The other time, was when he made 90.4% of his free throws during his freshman year. A lot of his comparisons go back to his freshman year.
- Quickness: Gatens isn't the most fleet of foot, and this has caused him some problems. I can remember multiple times where this has gotten him beaten on defense this year. Specifically, back door passes against Northwestern, quickly come to mind. This also limits his offensive game, and explains pretty well why he gets so much of his value from shooting the three point shot. He's not a threat to take the ball to the basket.
- Finishing at the Basket: Speaking of which, Gatens has always seemed to struggle when taking the ball to the hoop. He doesn't always go up strong, and that allows the opposing team's big men to contest or block the shot without Gatens drawing the foul. It's such a small part of his game, that it isn't necessarily a big deal for Gatens, except for games like at Minnesota this year, where he shot 1-6 (16.67%) on shots in the paint. But, it is interesting to note, that Gatens' 61.82% FG% on shots in the paint, was second worst on the team behind McCabe who shot a horrible 51.02%. The team average was 68.86%. So, yeah. That is why I listed this under weaknesses.
Saturday, March 12, 2011
2010-2011 Season in Review: Bryce Cartwright
Bryce Cartwright came out of nowhere for Iowa fans. Literally, nowhere. The point guard (who announcers loved to remind us was straight out of Compton) showed up on campus mysteriously for a visit last June. Four days later, he verbally committed to the Hawkeyes. He wasn't very hyped, and I, like most Hawkeye fans, didn't have high expectations for Cartwright this season. I mean, he committed in June, and everyone knows there aren't any good players waiting to sign in June. Well, Cartwright was a pleasant surprise. The expectations bar was set low, but Cartwright didn't just walk over it. He launched himself over it. Iowa's incumbent starting point guard, Cully Payne, went down for the season, and Cartwright was the only healthy point guard on the roster. He wasn't really anything special in November or December, but once Big 10 play kicked off, Cartwright exploded onto the scene. His 43.01% assist rate, finished number one in the Big 10 in conference play (he finished number two, overall, in the Big 10 in assist rate, behind Darius Morris). He wasn't perfect, as he was not the most efficient scorer, and did have a bit of a turnover problem. However, he exceeded all expectations that anybody had of him coming into the season. Coach McCaffery found a diamond in the rough.
Strengths:
Strengths:
- Passing the Ball- Cartwright became one of the best passing point guards Iowa has had in a long time. I have vivid memories of him threading that bounce pass into a streaking Jarryd Cole vs Purdue, throwing up close to half-court alley-oops to Eric May vs Michigan State, and delivering beautiful bounce passes on pick and rolls to Andrew Brommer for easy dunks.
- Transition- Cartwright was at his best this year, when he was in transition. Like I mentioned above, the bounce pass to Cole and the alley-oops to May, all came in transition. Cartwright also seemed to be at his best when he brought the ball up court, and immediately tried to get into the paint. That left him the option of taking the high percentage shot or finding Basabe or Cole for an easy layup.
- Shooting- Cartwright could put points on the scoreboard, but as his 42.08% eFG% shows, it often times took him a lot more shots than many would have liked. As you will see below, that also probably had a lot to do with the kinds of shots he takes. It still remains funny to me how an inefficient shooter like Cartwright, is Iowa's go to guy at the end of a game. I'm not a big believer in somebody being "clutch" (I use the term, but don't actually think that clutch is a talent), so I would prefer someone like Gatens taking the shot (who everybody says is the most unclutch guy on the team), since the percentages say he is the better shooter. However, Cartwright did hit key end of game jumpers at Indiana and vs Purdue. Not to mention, that he did hit six buzzer beating shots at halftime this year. He would have had seven, if he would have gotten that full court heave against Michigan off in time. This is nothing against Cartwright, I just don't believe in "clutch." I believe that one guy shoots a disproportionate amount of end of game shots, so he is more likely to make a few, and have the "clutch" label applied to him. Just my opinion. Now, back to your regularly scheduled program.
- Turnovers- Cartwright had a propensity to force some passes into guys who weren't open at times. His 24.05% turnover rate, was second worst only to Ohio State's Aaron Craft, in turnover rate by Big 10 points guards. I can't complain a whole lot, though, because that same aggressiveness that led to a few too many turnovers, is also the same aggressiveness that allowed him to rack up his conference play leading 43.01% assist rate.
Friday, March 11, 2011
Iowa vs Michigan State Round III Recap: 61-66 L
Well, the season is now officially over for the Hawkeyes. I can't really complain. Iowa's record wasn't amazing, but nobody expected it to be. All fans ask from a young team like this, is for improvement. I think we all have seen that improvement this year. Which means, Fran has kept his promise so far. He has got this fanbase excited about basketball again. So, thank you Fran. Let's do it again next season.
Just like eight days ago, life prevented me from watching Iowa play Michigan State. Although, this time I was actually able to listen to the first half on the radio. But, what follows is, once again, what I noticed from looking over the box score. It's weird to think that last year, I missed Iowa play Michigan in the Big 10 Tournament, because I was in a European Politics class. This year I missed it, because I had to work. Life needs to stop interfering with my sports.
Just like eight days ago, life prevented me from watching Iowa play Michigan State. Although, this time I was actually able to listen to the first half on the radio. But, what follows is, once again, what I noticed from looking over the box score. It's weird to think that last year, I missed Iowa play Michigan in the Big 10 Tournament, because I was in a European Politics class. This year I missed it, because I had to work. Life needs to stop interfering with my sports.
Sunday, March 6, 2011
Iowa vs Purdue Round II Recap: 67-65 W
WOOOOOOO!!!! That was easily the best win of the season, and a signature win for McCaffery. But, even better, it was also a the best possible way to send Jarryd Cole out. I'm sorry Jarryd had to be witness to such a down period in Iowa basketball, but I'm glad he got to exit Carver in style. Awesome. Fucking. Game.
Bullet Points!
Bullet Points!
- Shooting-wise, holy shit (I swear when I'm excited), Iowa went and did what Purdue did to them in the first match up. Iowa didn't shoot great, putting up a 45.8% effective FG%, themselves. However, they held the Boilermakers to a 39.9% effective FG%. Iowa made 46% of their two point shots, 30% of their three point shots, and 63.2% from the free throw line. Purdue made 45.4% of their two point attempts, 20% of their three point attempts, and 58.8% from the charity stripe. A clean sweep for the Hawkeyes. That hasn't happened very much in Big 10 play.
Saturday, March 5, 2011
What is Wrong With Eric May?
Coming into the season, a lot of people thought that, by the end of the year, Eric May could be the best player on the team. In November, he clearly looked the part. Now, though, he has become a role player, who doesn't seem to know his role. So, what the hell happened? Let's look at some numbers.
First, lets look at his points per minute and points per scoring attempt.

Clearly, Eric May shot out of his mind in November. He put up 1.20 points per scoring attempt that month, which helped him score 0.47 points per minute. Since then, however, he has pretty much dropped off the map. His points per minute have declined every month, and February is currently his worst scoring month this year.
Last year, May averaged exactly 1 point per scoring attempt. He is at 1.01 for the season thanks to his monstrous November. But, it's pretty clear to see over the last three months, that he is not putting the ball in the basket as efficiently as he is capable of.
So, what has led to the dip in shooting efficiency? Well, let's look at his shooting percentages.
Iowa vs Purdue Round II Preview
Hopefully, every single Hawkeye fan at Carver today will give Jarryd Cole a standing ovation. He has been through the darkest period in Iowa basketball history, and he's been nothing short of classy about the whole situation. He has been a solid guy on the court, and a quality character guy off of it. I for one, am going to miss Jarryd Cole. It's too bad he never got a chance to be a part of a winning Iowa Hawkeye team. He deserved better. Thank you, Jarryd.
Now, the preview.
Last time:
Iowa vs Purdue Preview
Iowa vs Purdue Recap: 55-72 L
Iowa Offense vs Purdue Defense

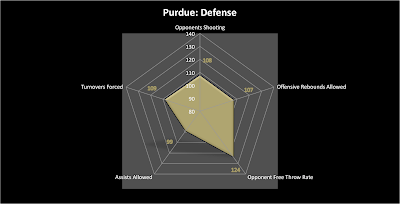
Iowa's offense is in for a fun one today! Purdue's defense is really damn good. After the Michigan State debacle, Iowa is still 1% below the NCAA average in effective FG%. Purdue, on the other hand, is 8% better than the NCAA average at contesting shots. Their 45.6% opponent effective FG%, is number one in the Big 10. Last time, Purdue held Iowa to a 38.5% effective FG%. While I wouldn't expect Iowa to shoot that horrible again, I wouldn't be surprised at all if they do either.
Subscribe to:
Comments (Atom)